The leaflet that started it

A bus map for one small town took over a hundred volunteer hours and a thousand pounds of design work. Could a computer do it for everywhere?

“I didn't know the bus went there”

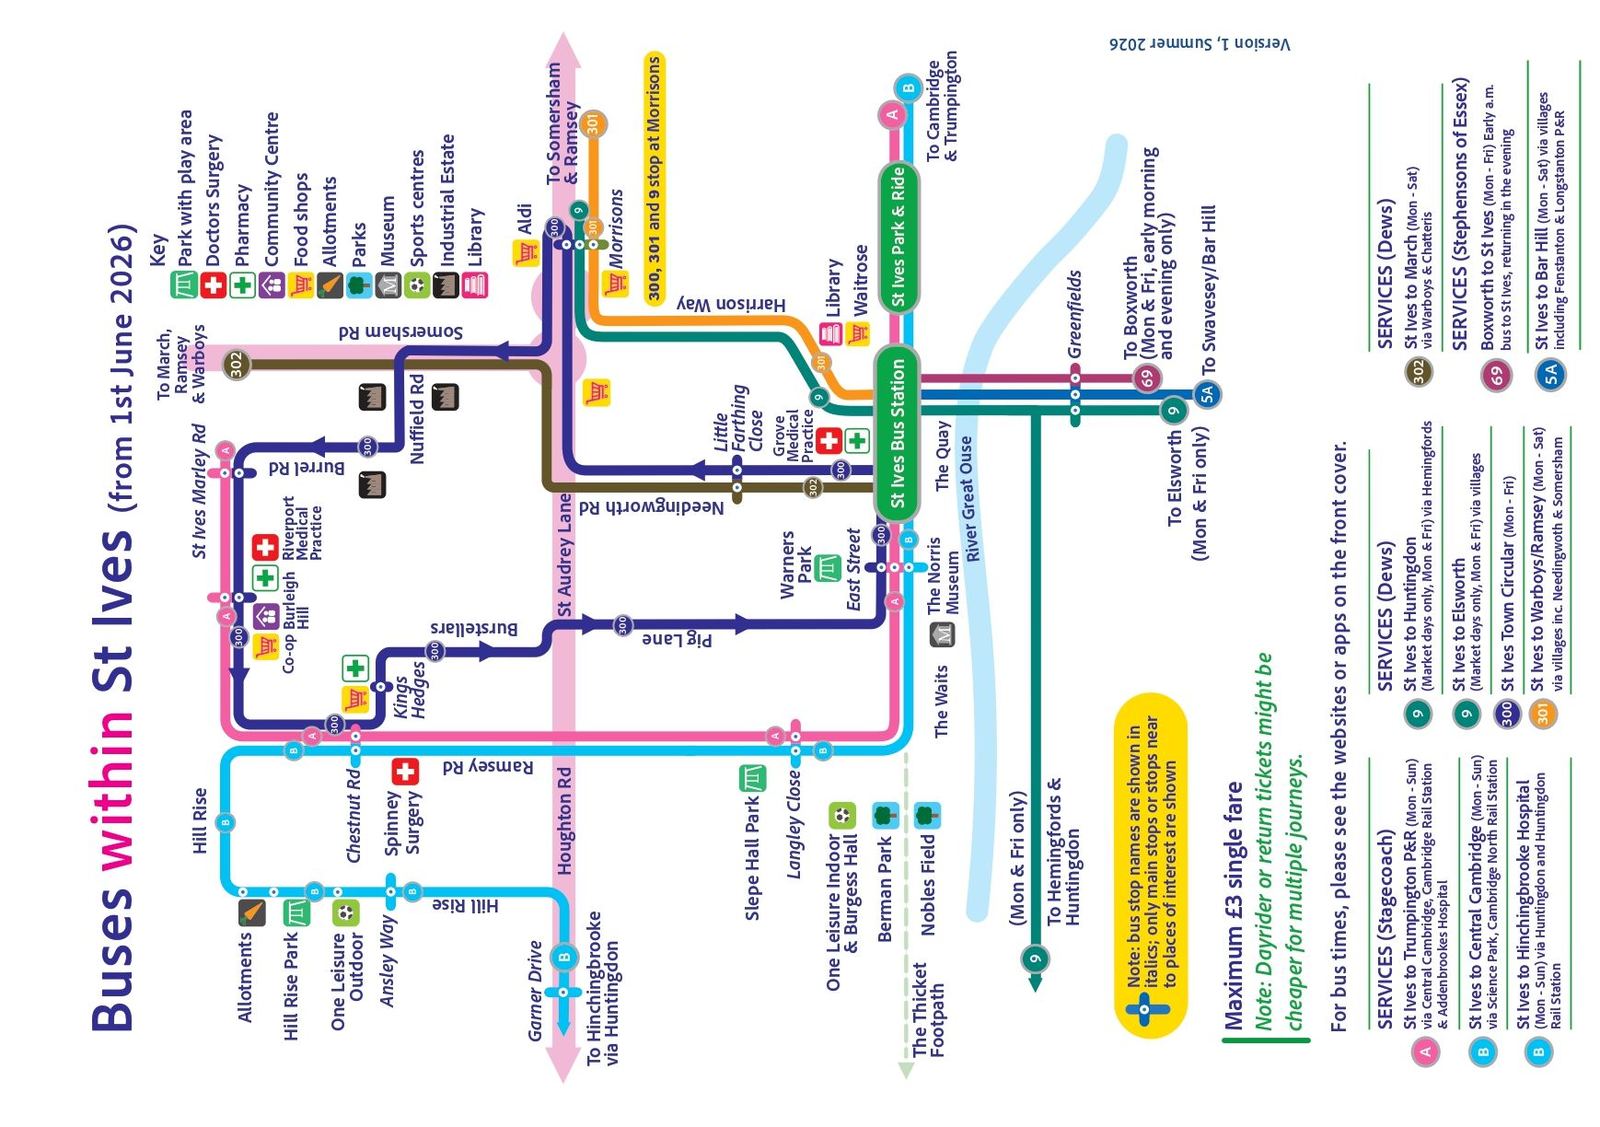
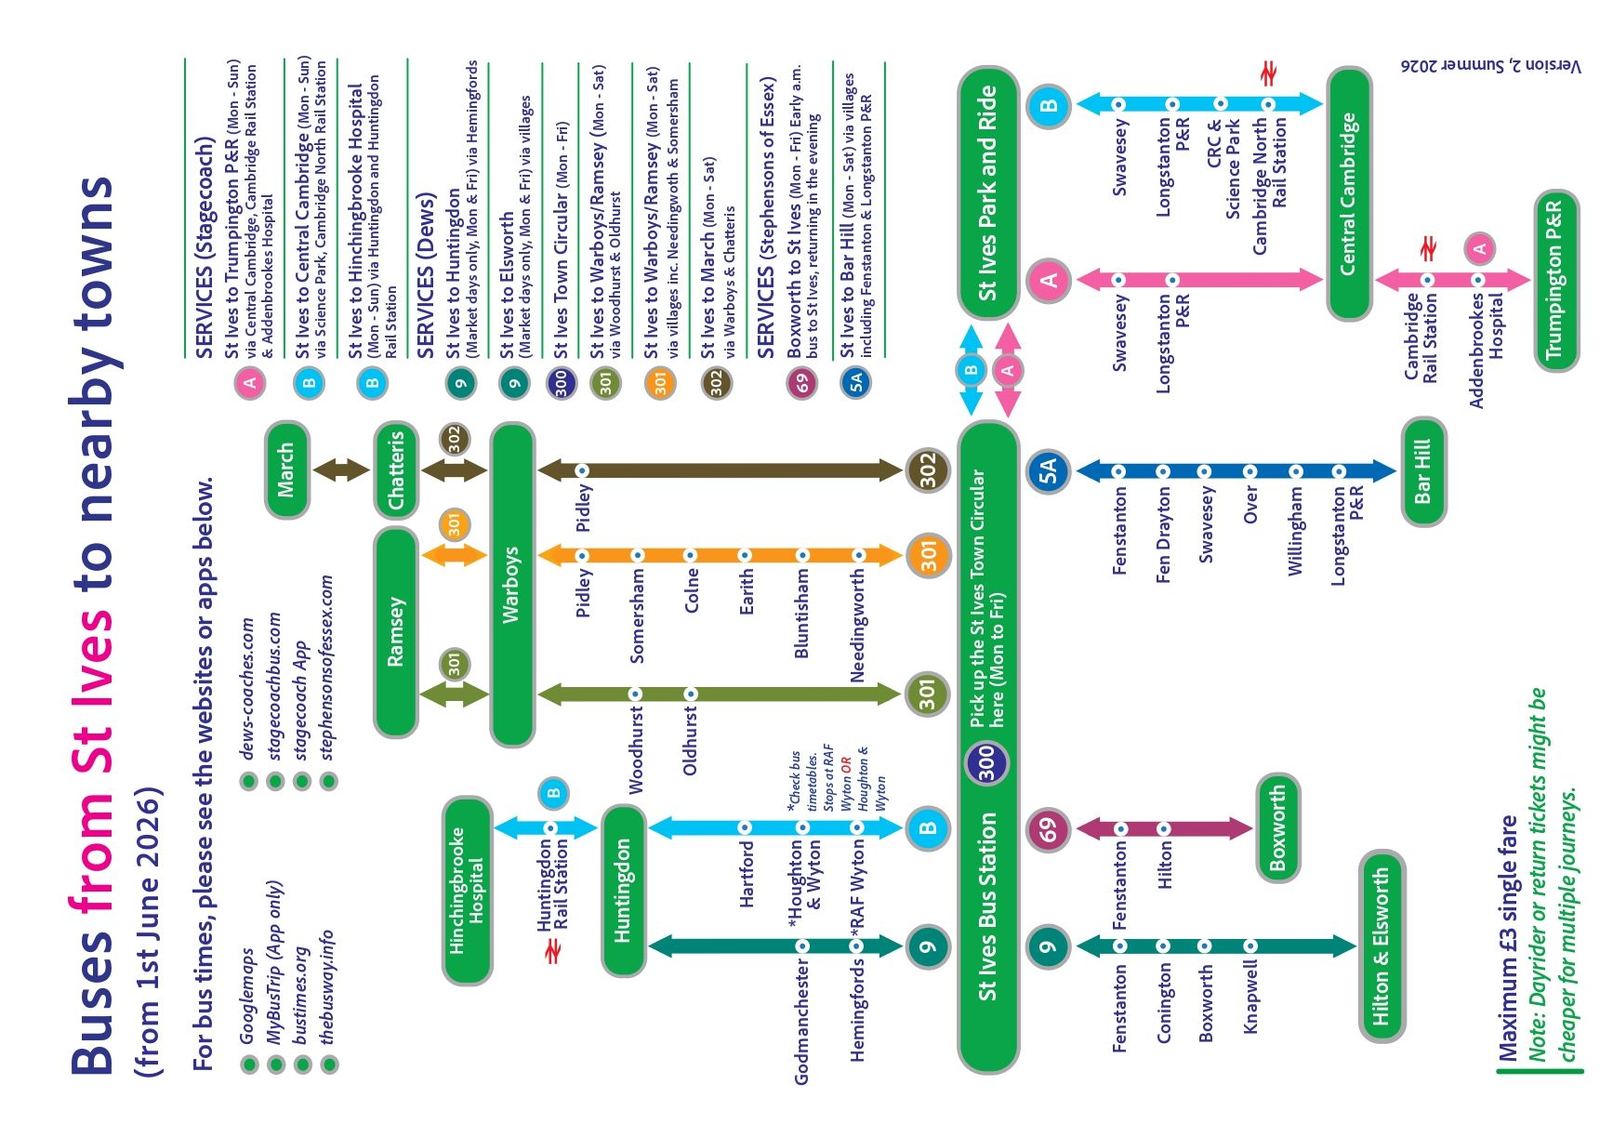
In the spring of 2026 a group of volunteers from St Ives Town Council produced a bus leaflet for the town. Two sides of A4: one showing the buses that move about within St Ives, the other showing where you can get to from the bus station and which service takes you there.

What happened when people picked it up was the thing that stuck. Again and again, the reaction was some version of the same sentence — I didn't know the bus went there. Not from people who had considered the bus and rejected it. From people who had never known it was an option at all.

That is a strange kind of failure. The buses were running. They were funded, timetabled, and in many cases going past the end of somebody's road with empty seats on them. The information existed too — in an app, on an operator's website, on a stop flag. What was missing was the one thing that answers the question people actually ask, which is not when is the next 301? but can I get to Huntingdon, and how?

The 2026 St Ives volunteer leaflet, inner side: a colour-coded street schematic titled Buses within St Ives, with route lines, place-of-interest icons and a services list. The 2026 St Ives volunteer leaflet, outer side: a diagram titled Buses from St Ives to nearby towns, with straight coloured lines running out from the bus station to Cambridge, Huntingdon, March and other destinations.

The leaflet that started it

St Ives, summer 2026. Drawn by hand in a design package by a professional designer, from route information the volunteers assembled themselves. It is a good piece of work, and it is the standard everything since has been measured against.

Click either map to see it full size
What one leaflet costs

The leaflet worked. The problem was what it took to make.

100+ hours

of volunteer time gathering and checking the route information.

£1,000

of professional design work to turn it into artwork.

One town

for one summer, before the services change again.

Printing was on top of that. And the map carries its own expiry date in the title — from 1st June 2026 — because bus routes are not fixed. Operators change them, withdraw them and re-number them several times a year. Every change makes the leaflet a little more wrong, and there is no cheap way to put it right: correcting it means going back to the designer, or living with a map that misleads people.

Multiply that by every market town in England that does not have one. The arithmetic simply does not work. Not because nobody cares — the volunteers cared enormously — but because a hundred hours and a thousand pounds per town, repeated every time a timetable moves, is a bill nobody is going to pay.

The question worth answering

The route data is not secret. Since the Bus Open Data Service came in, every operator in England has to publish its timetables and stop lists in a standard machine-readable form. The stops themselves are in a national register. The streets, the schools, the surgeries and the supermarkets are in OpenStreetMap. All of the raw material for the St Ives leaflet was, in principle, sitting in public databases the whole time.

What was expensive was the judgement in between: deciding which services matter, which places a reader would recognise, where a line should bend, what to leave out. That is exactly the sort of work that has always needed a person — and exactly the sort of work that large language models have recently got surprisingly good at.

So the question was narrow and testable. Could AI be used to build something that turns the open data into a map as good as the one the volunteers made — and if it worked once, would it work for anywhere?

How the AI is actually used. Not to draw the pictures. It was used to write the software that draws them — and to do the judgement work that software is bad at: reading operator timetables against the open data feed and flagging where they disagree, deciding how a route should be labelled, and checking finished maps for mistakes. The maps themselves come out of code, from public data, with no network and no AI at drawing time, so the same inputs always produce the same map.

What comes out

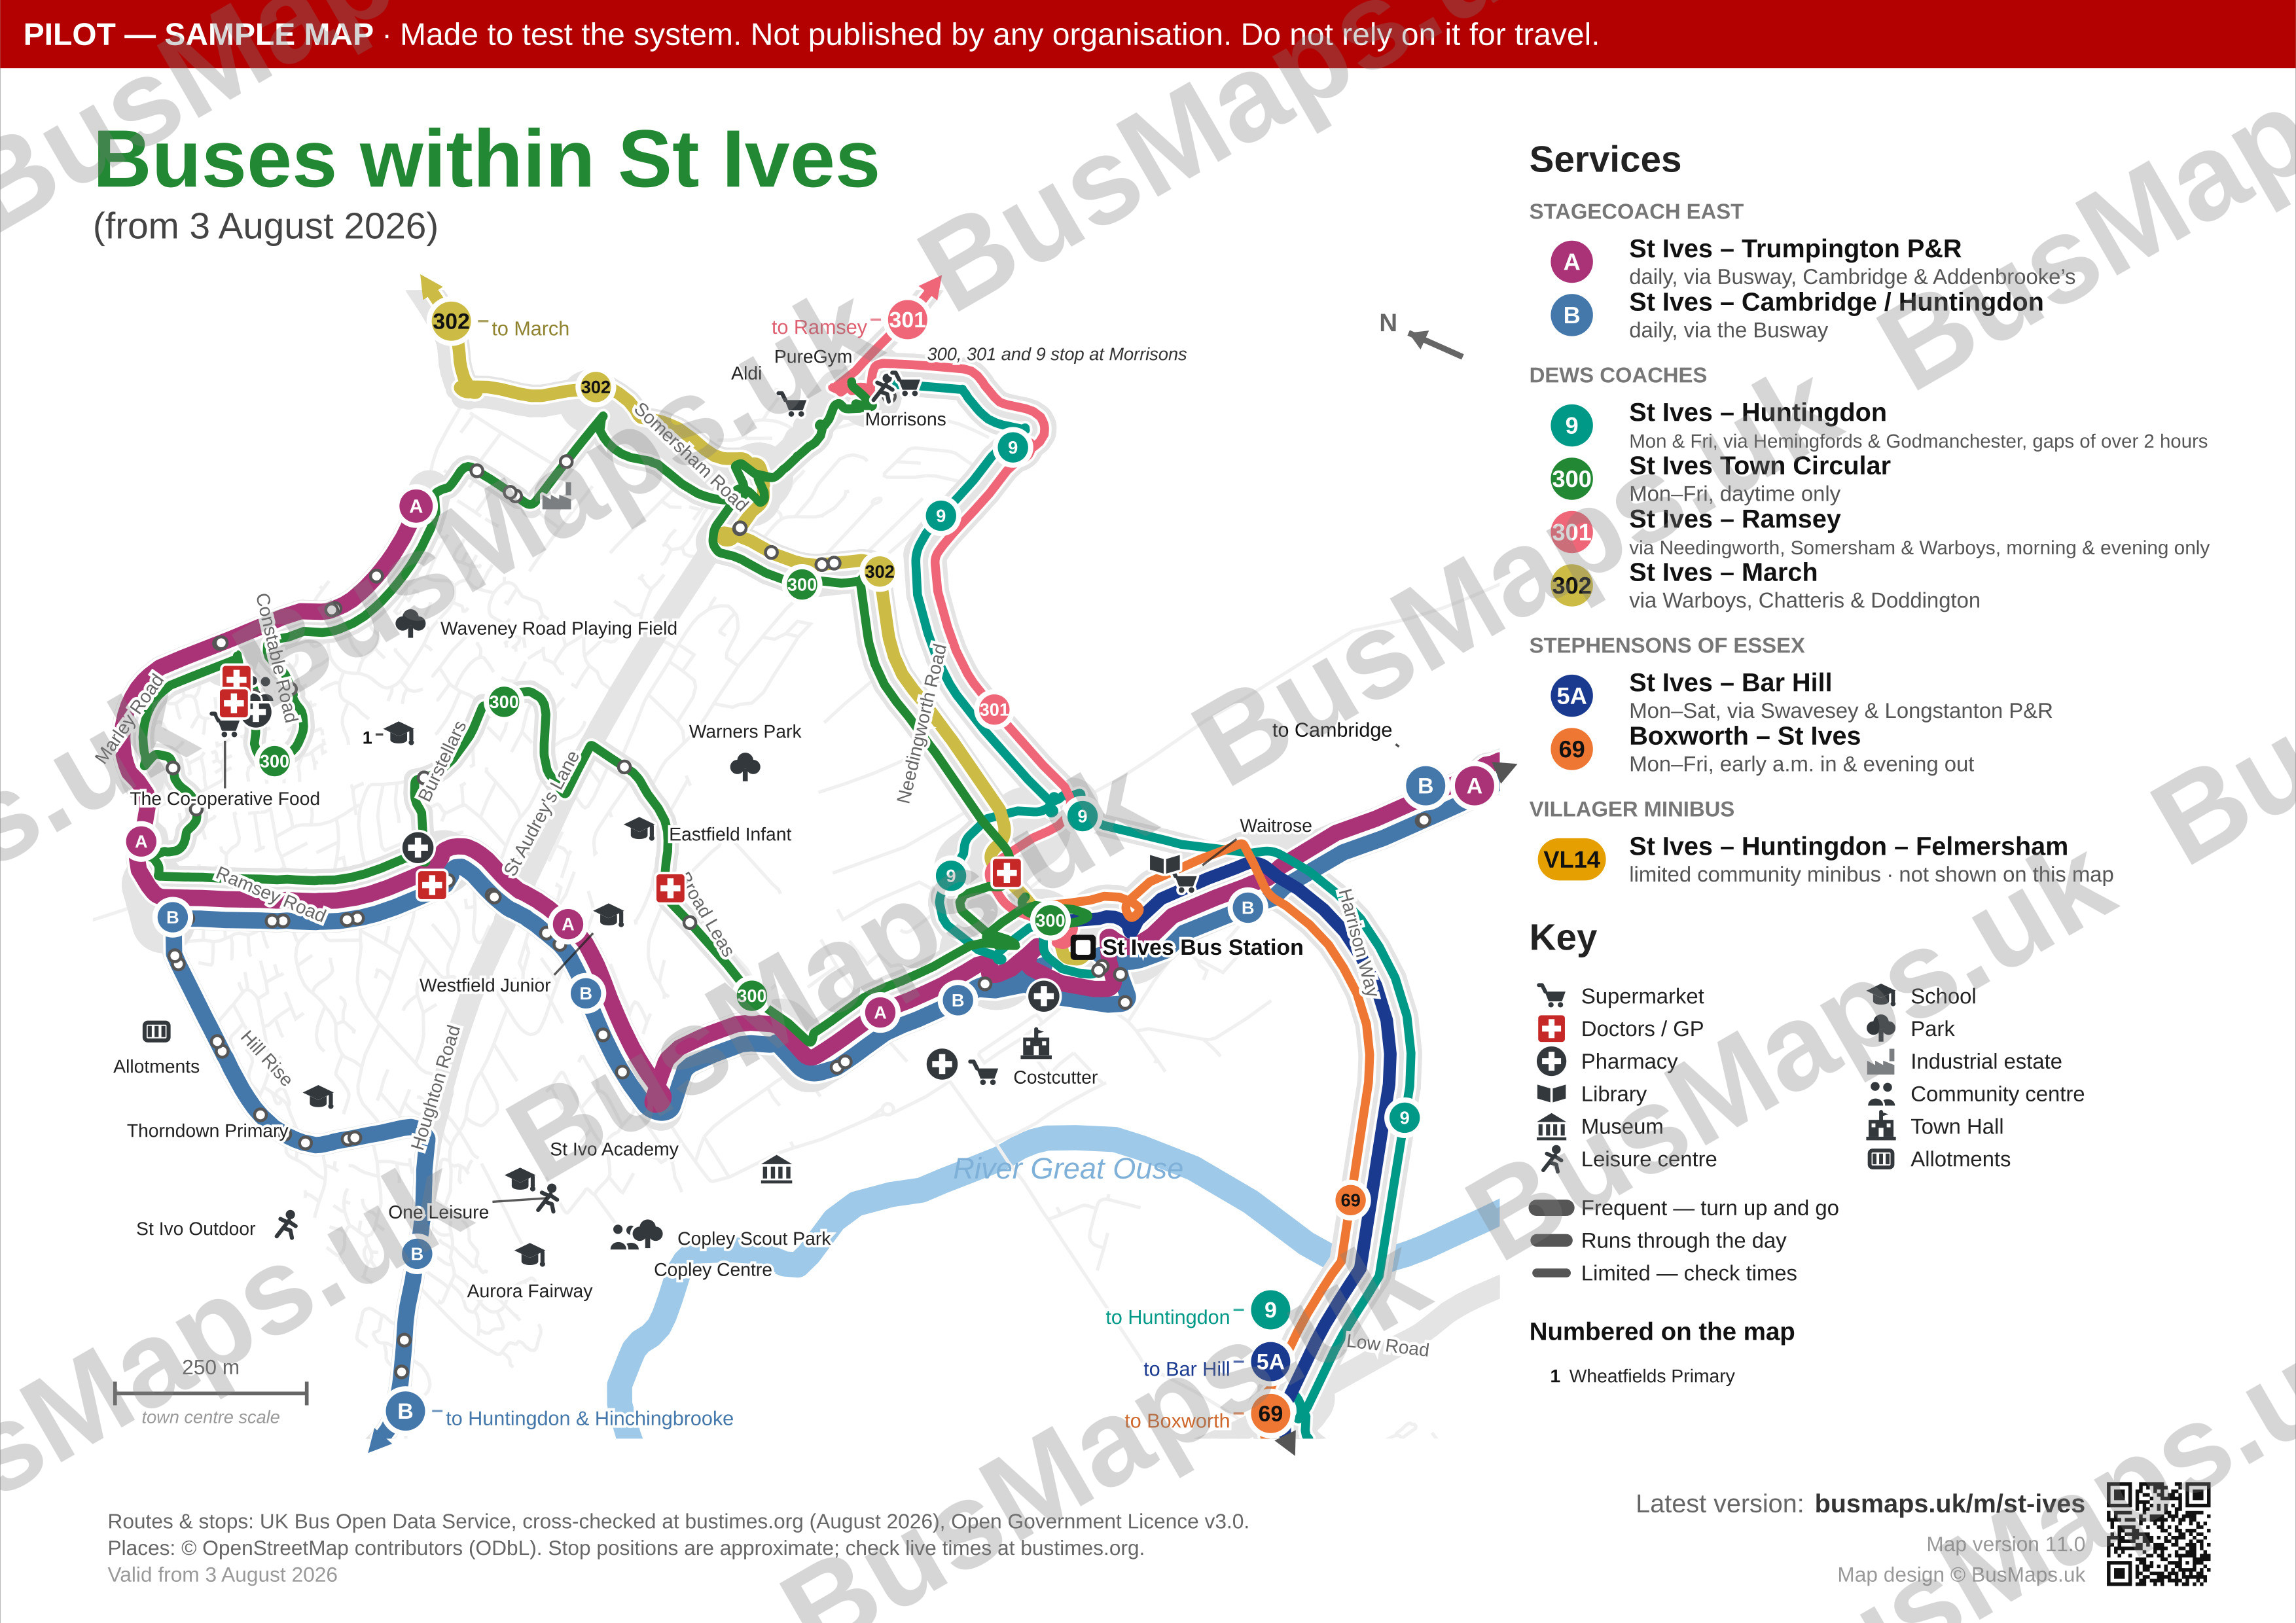
It works. The two maps below are St Ives again, built by the system from the open data rather than by hand, and deliberately answering the same two questions the volunteers' leaflet answered.

A generated map titled Buses within St Ives: coloured bus routes drawn over the real street layout, with icons for schools, doctors, supermarkets and parks, a services panel listing each operator and route, and a key. A generated radial diagram titled Buses from St Ives to nearby places: coloured spokes run out from St Ives Bus Station to Cambridge, Huntingdon, March, Ramsey and other destinations, each labelled with intermediate villages and a route badge.

Area The same town, generated

Routes and stops from the UK Bus Open Data Service, cross-checked against operators at bustimes.org; streets and places from OpenStreetMap. Both maps are A4 and print at 300 dpi.

Click either map to see it full size
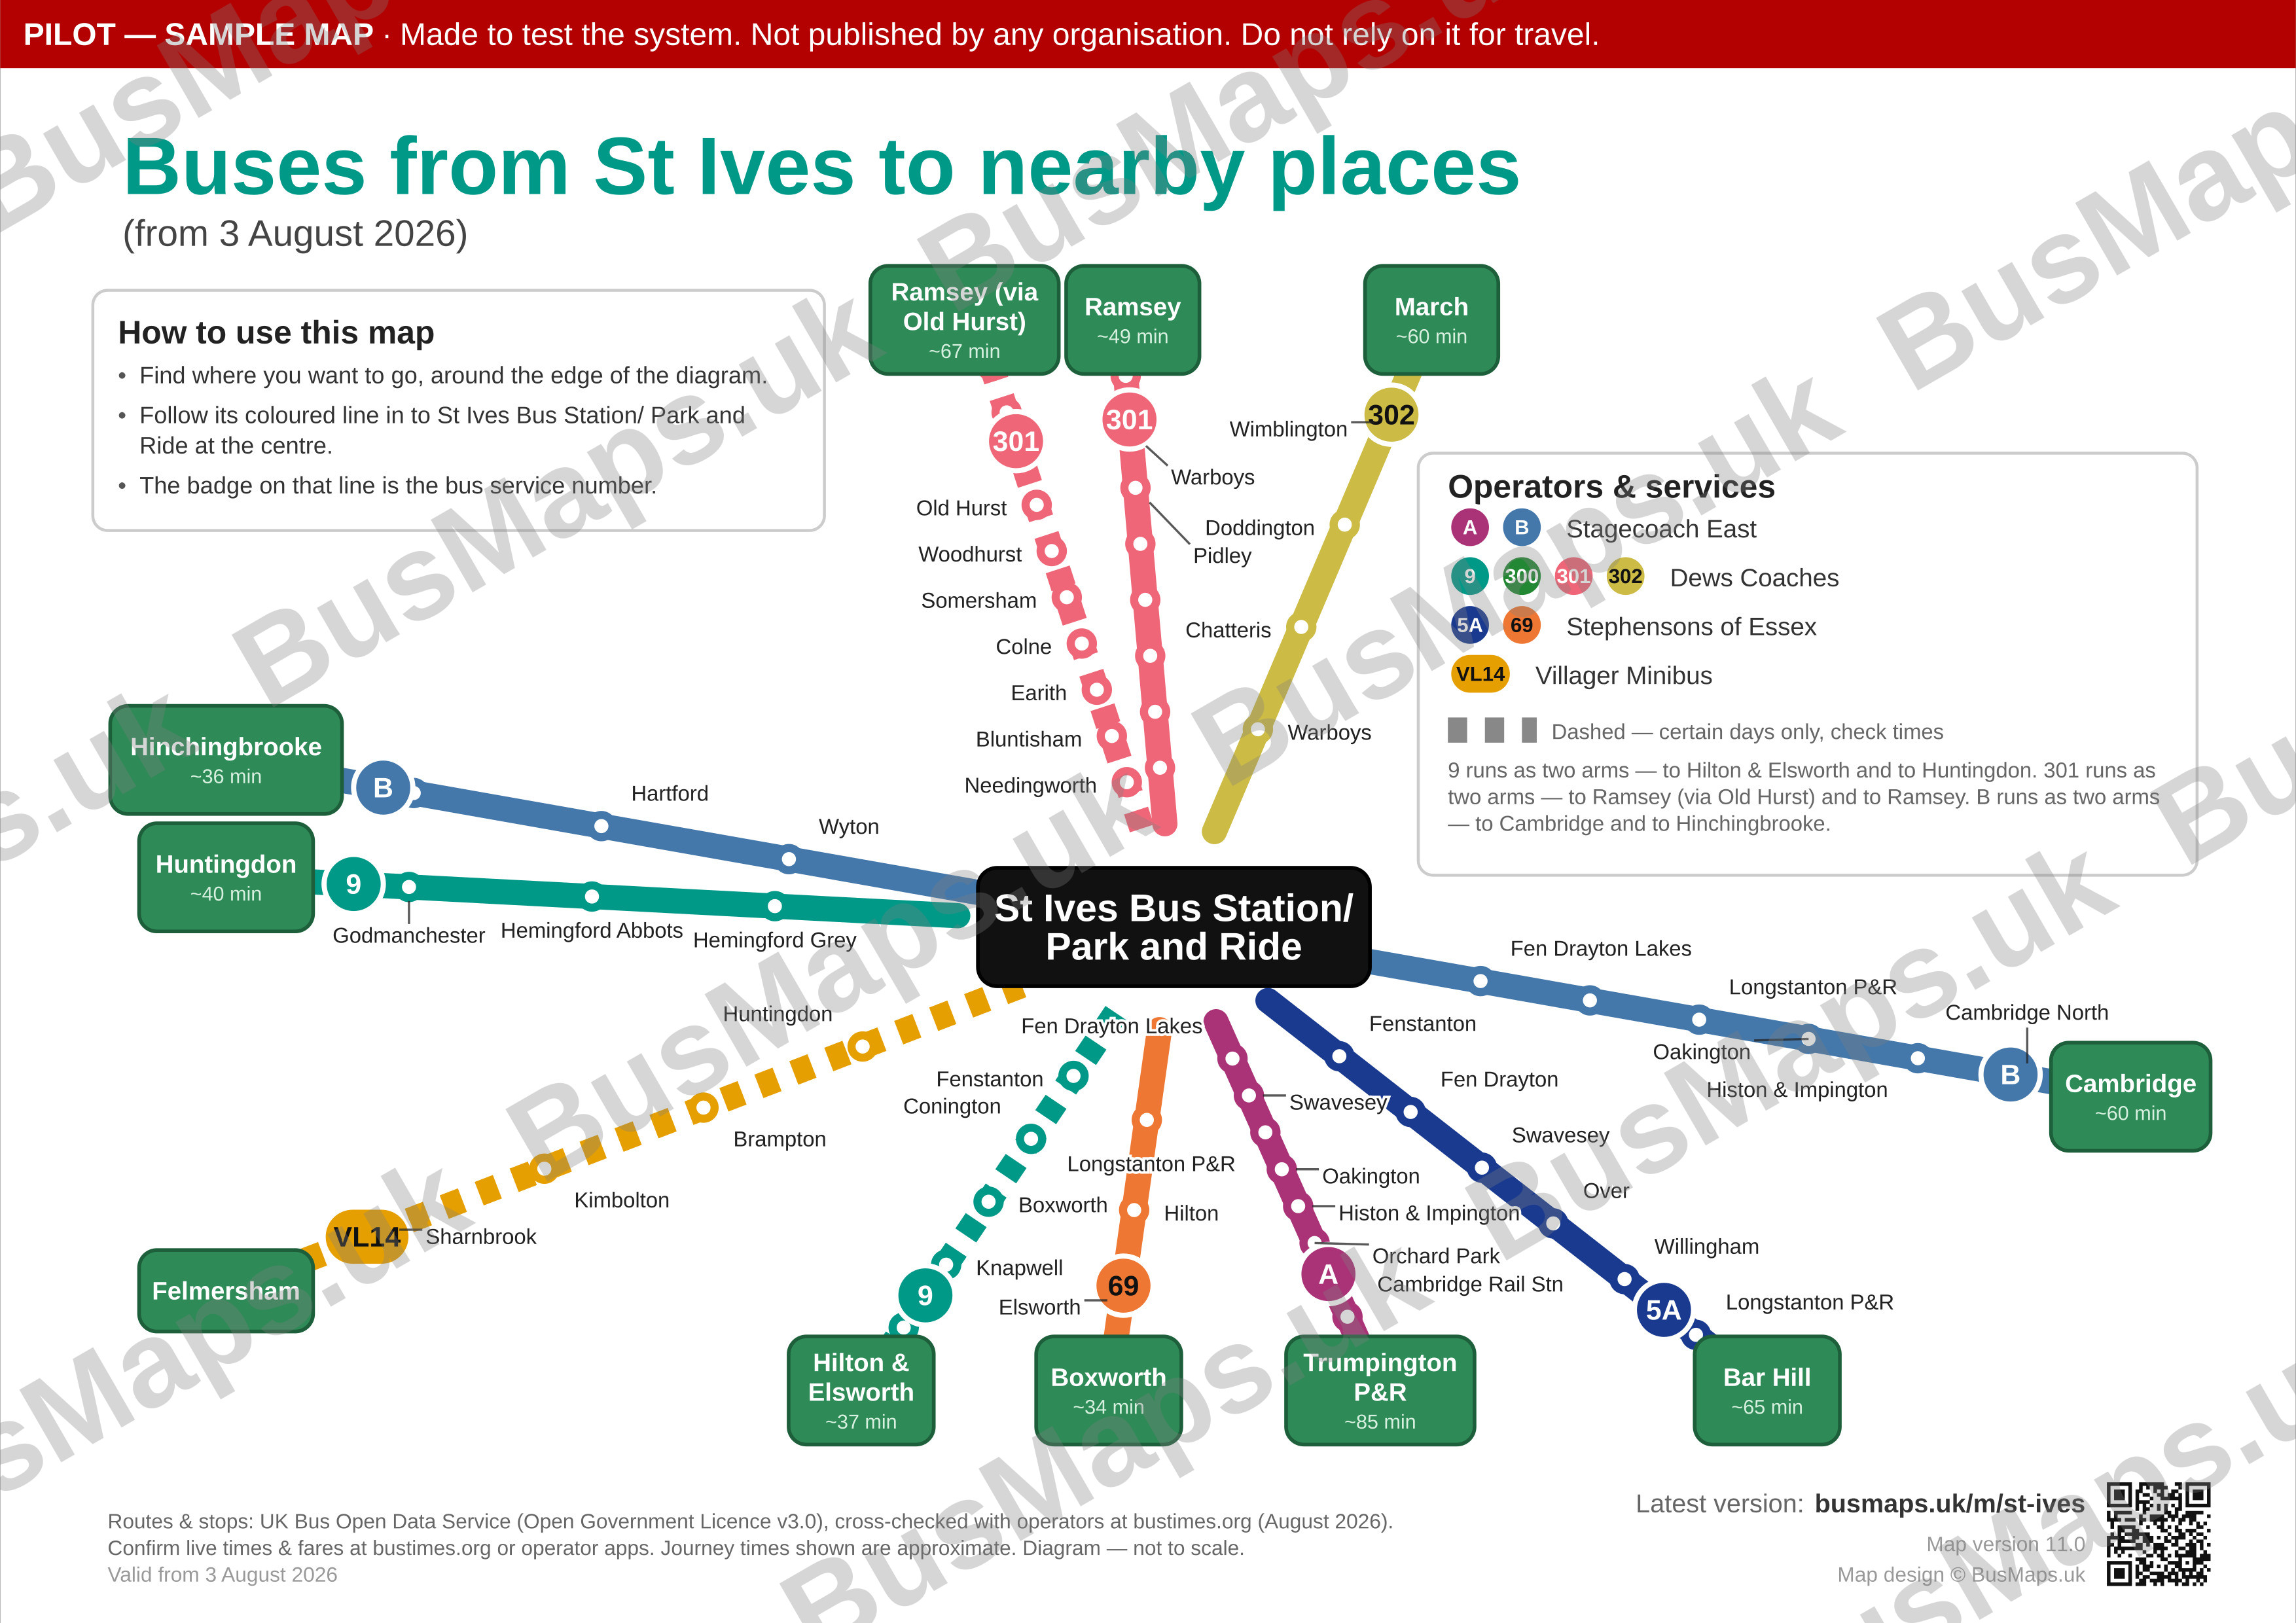
They are not identical to the originals, and they were never meant to be. The street map is drawn to the real geography rather than straightened out, so the shape of the town is recognisable. The destinations map is a radial diagram: find where you want to go around the edge, follow the coloured line in to the middle, and the badge on it is the bus you need. Both maps say when the data was collected and where it came from, because a map that will go out of date should admit it.

The cost of the second town was a fraction of the first, and the cost of the twentieth was almost nothing. That is the whole point of doing it this way: the expensive part is building the machine once, not making the map each time.

Why bother, when everything is on a phone

This is the fair objection, and it deserves a straight answer. There are good bus apps. Google Maps will plan a journey. bustimes.org is excellent and free. None of this is trying to replace any of them.

What those tools all have in common is that you have to know what to ask. They will tell you brilliantly how to get from here to a place you have already thought of. They will not tell you that there is a bus to somewhere you never considered — and that, going back to the reaction the leaflet got, is the gap.

A map on a wall does something an app cannot. You can stand in front of it without having decided anything. You can see the whole network at once. Someone can point at it. It is there in the doctor's waiting room, the library, the parish noticeboard, the sheltered housing lounge — in front of exactly the people least likely to be running a journey planner, and most likely to be stuck at home.

The current national policy framework for buses commits to passengers getting accurate, accessible, easy-to-understand information. It talks about open data, live arrivals and app developers. It does not mention maps once.
Department for Transport, The government's vision for buses and approach to delivery, April 2026.

And underneath the practical argument there is the one that actually motivates it. The buses are running anyway. Filling the empty seats costs nothing extra. What it buys is somebody getting out of the house — to the shops, to a class, to see a friend, to a hospital appointment they would otherwise have missed. Loneliness and isolation are not solved by a bus map. But not knowing the bus exists is a very stupid reason to stay in.

Where it has got to

Maps for eight towns — St Ives, Huntingdon, St Neots, Ramsey, March and Wisbech in Cambridgeshire, and High Wycombe and Beaconsfield in Buckinghamshire — plus a handful of maps built around a single place rather than a whole town: a supermarket, a high street, the kind of destination where the useful question is simply which buses stop here?

It is honestly still a pilot, and this site says so on every page. One organisation has signed up — a community association in St Neots, which publishes four of these maps under its own name — and there is no income, from them or from anyone else; every other map here is one we made ourselves. Maps get things wrong and get taken down and rebuilt, and the most useful thing that happens to this project is somebody who knows an area writing in to say that a line is going the wrong way — because that has twice now turned out to be a fault in the software rather than in one map.

Four things hold that together:

  • Every map is built from public, licensed open data, and says so in its footer.
  • Every map is checked against the operators' own timetables before it goes up, and the disagreements are written down rather than quietly resolved.
  • The software is source-available now and becomes fully open source in 2030, so nobody is left stranded if this stops.
  • The project is non-partisan. Any organisation whose community uses the bus may publish a map, whatever its politics, because a map shows only what the open data shows and carries only the name of whoever published it.

Which leaves the question of what it becomes. A one-person pilot is not a service, and the thing that would make this worth having — a map for every market town in the country, kept right as the timetables move — is bigger than one person and needs to belong to something more durable than a hobby. The likeliest shape is a community interest company: not-for-profit by constitution, able to charge the organisations that can pay so the ones that cannot still get a map. That is a conversation rather than a plan, and if it interests you it is very much worth having.

The original 2026 St Ives leaflet was produced by volunteers from St Ives Town Council; the figures for it are their own estimate of the time and the invoiced design cost, and exclude printing.